Chapter 5:
EQUATION OF STATE
|
|
In Chapter 3, we assumed the approximated functions under a fixed volume per particle that predict the interaction energy and the interaction entropy of the cluster phase and the monomer phase, and confirmed the approximated functions well reproduce the MC results of the Helmholtz free energy of the homogeneous nucleation. In this chapter, we purpose to develop the equation of state (EOS) of Helmholtz free energy of the nucleation as a function of the number of particles N, temperature T, and volume per particle V/N by taking into consideration the dependence on the volume per particle of the thermodynamic properties. Moreover, we rearrange the EOS to estimate Gibbs free energy of the nucleation as a function of N, T, and pressure P by taking into consideration contributions of the pressure and the ideal gas term.
|
|
5.1. Volume Dependence of the Thermodynamic Properties |
5.1.1. Monomer phase
As we stated above, interaction energy and interaction entropy of the monomer phase is assumed that it have no dependence on temperature. Before the discussion about the volume dependence of the thermodynamic properties, we consider whether the pressure of the monomer phase has the temperature dependence or not. Figure 5.1 shows the temperature dependence of the interaction term of pressure, Pe = P - NkT/V, in the phase transition calculation. Since the interaction pressure levels off against the temperature after the decomposition of the cluster, we assume the equilibrated value of the decomposed monomer phase in the phase transition calculation into the Pe of the monomer phase.
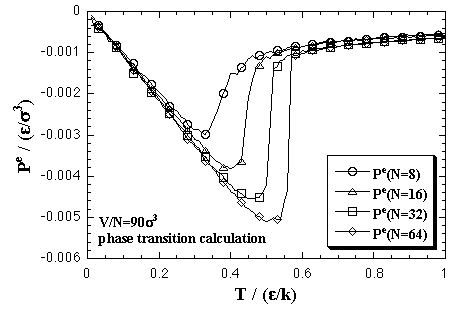 |
| Fig. 5.1. Temperature dependence of the interaction term of pressure in the phase transition calculation at V/N = 90 σ3. The curves leveled off after decomposition of the cluster. |
The volume dependence of the thermodynamic properties is discussed in below (omitted: essentials in Figs. 5.2-5.4). On the basis of the discussions and the approximated functions designed under a fixed volume per particle as eqs. 3.1 and 3.2, we defined approximated functions for the interaction energy, the interaction entropy, and the interaction term of pressure of the monomer phase that depend on the number of particles and the volume per particle as:[13,14]
The pressure term is treated as PmeV term per particle coordinate with the interaction energy and the interaction entropy. The coefficients ai, bi, and ci are obtained by least-squares fittings similarly to Chapter 3, which results are shown in Figs. 5.2-5.4.
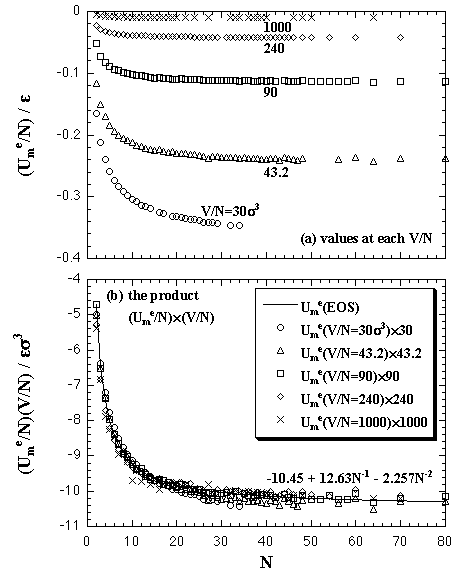 |
| Fig. 5.2. Interaction energy of the monomer phase versus the number of particles plots on each volume per particle. The figure (a) shows the values at each simulated volume per particle, and (b) the product of the interaction energy and the volume per particle. The circles, triangles, squares, diamonds, and crosses show the MC result. The solid curve shows the result of the least-squares fitting by eq. 5.7. |
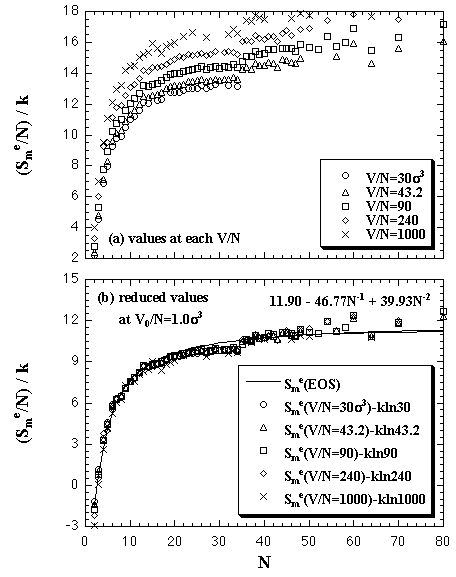 |
| Fig. 5.3. The density dependence of the interaction entropy per particle of the monomer phase. The figure (a) shows the values at each simulated volume per particle, and (b) the reduced value into the standard of V0/N = 1.0 σ3. The solid curve shows the result of the least-squares fitting by eq. 5.8. |
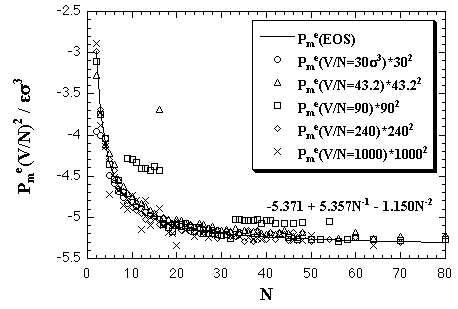 |
| Fig. 5.4. The product of Pme and (V/N)2 versus N plots. Similarly to the interaction energy and the interaction entropy, the products of the interaction pressures and the square of the volumes per particles roughly agree each other. The solid curve shows the result of the least-squares fitting by eq. 5.9. |
|
5.1.2. Cluster phase
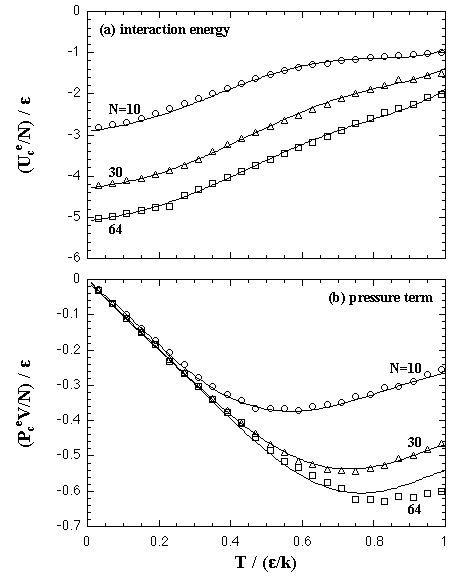
The density dependence of interaction energy, interaction entropy and interaction part of pressure term of the cluster phase is mentioned below. In our model, the cluster phase contains an N-particle cluster and no vapor phase particles in surroundings of the cluster, like Fig. 2.2. Since the model has no interaction between the cluster and the surroundings, if the shape of cluster was similar each other, there is no dependence on the system density in which thermodynamic properties. Such example is shown in Fig. 5.5 in the case of 27-particle systems; all the superheated clusters on each volume per particle are spherical similarly. On the contrary, the stretched cluster mentioned above, like as Fig. 4.2, disagrees with the spherical cluster in which thermodynamic properties. Such examples are shown in Fig. 5.6 in the case of 47-particle systems: the stretched cluster is obtained at V/N = 90 σ3. In the figures (a) and (b), the thermodynamic properties have disagreements each other at high-temperature (ca. T > 0.7 ε/k). However, in the figure (c), the Helmholtz and the Gibbs free energies agree closely. The agreement is caused that the disagreements of Uce and Scee are canceled in the Helmholtz free energy and the disagreement of PceV term is much smaller (10-2 ε order) than the values of the free energies.
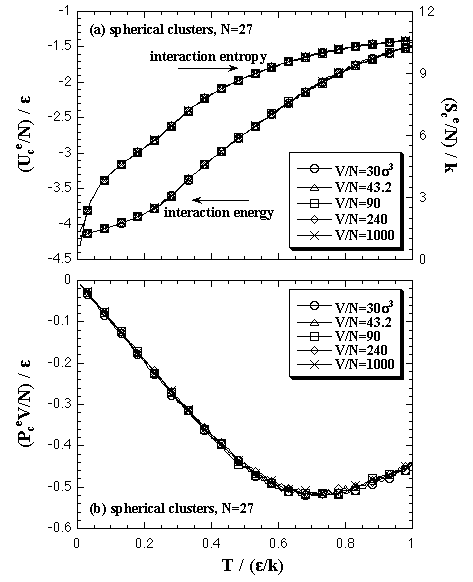 |
| Fig. 5.5. The interaction energy, the interaction entropy, and the pressure term of the cluster phase calculations on each volume per particle in 27-particle system. The 27-particle systems obtain similarly spherical cluster phases on the each volume per particle. |
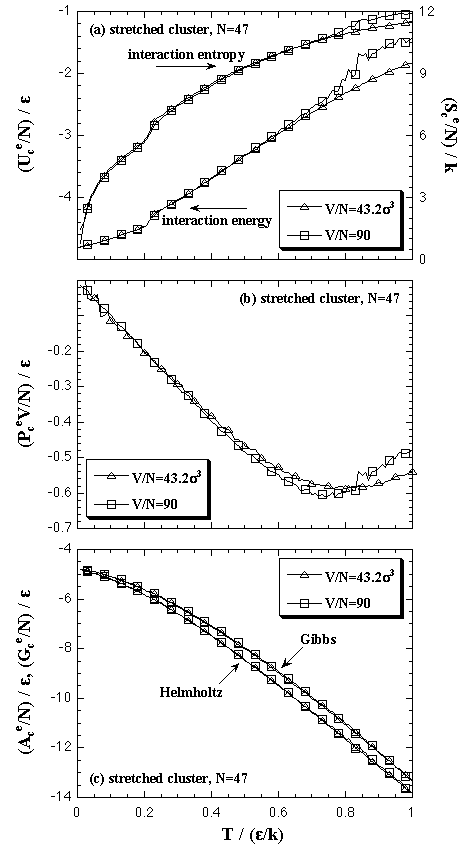 |
| Fig. 5.6. The V/N dependence of the thermodynamic properties in 47-particle system. Though the Uce, Sce, and PceV disagree on each volume per particle caused by the stretched cluster, there are no disagreements on the Ace and Gce. |
In Chapter 3, we were obliged to approximate the interaction energy and the interaction entropy of the cluster phase separately. The dispersion of the interaction energy that was due to appearance of the stretched cluster caused the approximation by one function to be unsuccessful. Besides, in the aims of estimating the Helmholtz and Gibbs free energies, both the spherical cluster and the stretched cluster give roughly similar values. Accordingly, we removed the stretched clusters from the subjects of the approximation and attempted to approximate the interaction energy and the interaction entropy as one function. The approximated functions for the Uce (and it also predicts the Sce) and the PceV term of the cluster phase are:
 | (5.10) |
 | (5.11) |
The approximation of eq. 5.10 is performed as (Uce/NT) for the purpose of fitting accuracy, similarly to eq. 3.3. As results of the least squares fittings, we obtained the fitted curves as shown in Fig. 5.8.
 |
| Fig. 5.8. Fitting results of the cluster phase: (a) the interaction energy, while (b) the product of the interaction term of pressure and volume per particle. The circles, triangles, and squares are the MC results and the curves are the EOS. Care should be taken that the approximated functions for the cluster phase, eqs. 5.10 and 5.11, have no dependence on the volume per particle. |
|
|
5.2. Equation of State of the Nucleation Free Energy |
The Helmholtz free energy of the nucleation ΔA on (N,T,V) domain is obtained by eq. 2.9. In Fig. 5.10, we compare the ΔA from the EOS and the results of the MC simulations. Figure 5.11 shows the values of the critical nucleus, the size NA* and the nucleation energy ΔA*, that is obtained from the maximum of the nucleation energy curve.
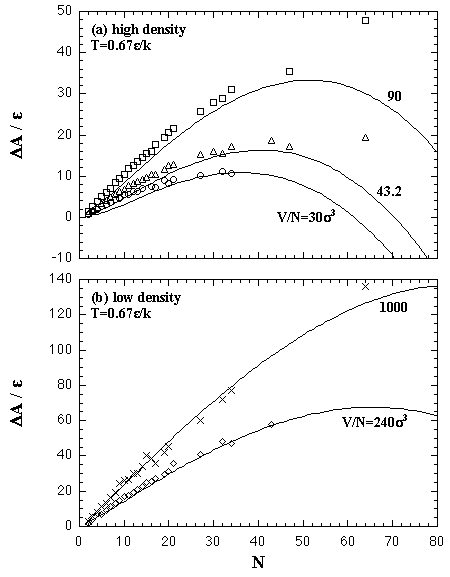 |
| Fig. 5.10. Helmholtz free energy of the homogeneous nucleation on (N,T,V) domain at T = 0.67 ε/k. The curves at high-density region, V/N = 30, 43.2, and 90 σ3, are plotted in the figure (a), while low-density in the figure (b). Circles, triangles, squares, diamonds, and crosses are the MC results and the curves are the EOS. |
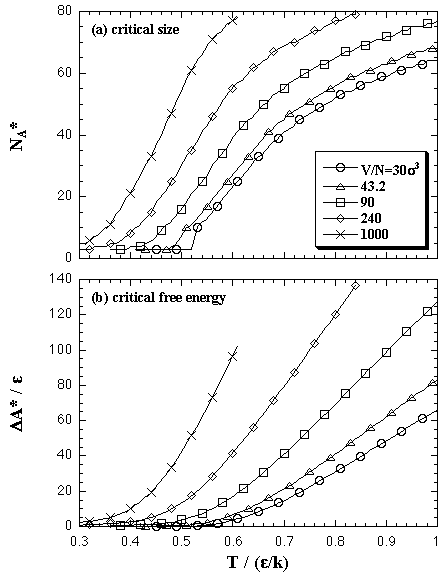 |
| Fig. 5.11. The values of the critical nucleus on (N,T,V) domain: (a) the size NA* and (b) the Helmholtz free energy ΔA*. |
On the other hand, as we mentioned above, the Gibbs free energy of the nucleation should be obtained under constant pressure and the ideal gas term should be included in the process of obtaining ΔG, like eqs. 2.11 and 2.12. We obtained the ΔG on (N,T,P) domain with the following procedure.
Thus far, the interaction terms of thermodynamic properties were only treated and the ideal gas terms were not considered in the purpose of the ΔA estimation. In the following, to make a relationship between the simulation results and the ideal gas, we assumed the thermodynamic properties of the monomer phase resemble those of the ideal gas. An interaction term of the Helmholtz free energy of the monomer phase can be obtained from the density integration of the compressibility factor at each number of particles as ZAme:[14]
 | (5.12) |
This reestimtes the interaction term of Gibbs free energy of the monomer phase Gme(N,T,Vm). On the other hand, the interaction term of Gibbs free energy of the cluster phase, Gce(N,T,Vc), is obtained as
 | (5.15) |
 | (5.16) |
The ideal gas term of the Gibbs free energy Gid is defined by the statistical thermodynamics as:
 | (5.17) |
Here, the symbols q, Λ, h, and m indicate the molecular partition function, the thermal wavelength, the Planck's constant, and mass of the particle. We obtained the ideal gas term of entropy with the LJ parameters and the mass of argon molecule, as ε/k = 119.8 K, σ = 0.3405 nm, and m = 6.634×10⁻²⁶ kg. Volumes of the cluster phase and the monomer phase, Vc and Vm, that present the identical pressure P, are obtained from eqs. 5.9 and 5.11 as:
 | (5.18) |
The Vm/N and Vc/N at some pressures, 0.0127, 0.00679, and 0.00270 ε/σ3, are plotted in Fig. 5.12. In the case of P = 0.0679 ε/σ3, the Vm/N is roughly constant at 90 σ3, while the Vc/N changes from 90.6 σ3 at N = 2 to 10.4 σ3 at N = 80.
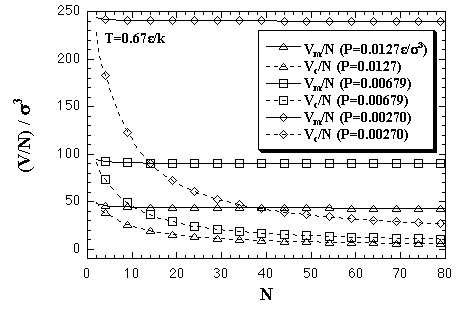 |
| Fig. 5.12. Volumes per particle of the monomer phase and the cluster phase at T = 0.67 ε/k; that are obtained from eq. 5.18. The pressure in LJ reduced units corresponds as 1.0 ε/σ3 = 41.9 MPa in the case of argon. |
The above equations yield the Gibbs free energy of the nucleation on (N,T,P) domain with eq. 2.12. Figure 5.13 shows the ΔG(N,T,P). In the high-density (high-pressure) region, Fig. 5.13 (a), the ΔG curves are somewhat overestimated; the value seems to have risen excessively at the large-N region. On the other hand, the curves of the low-density (low-pressure) region, Fig. 5.13 (b), are lower than the curves of the ΔA on corresponding volumes per particle, like Fig. 5.10.
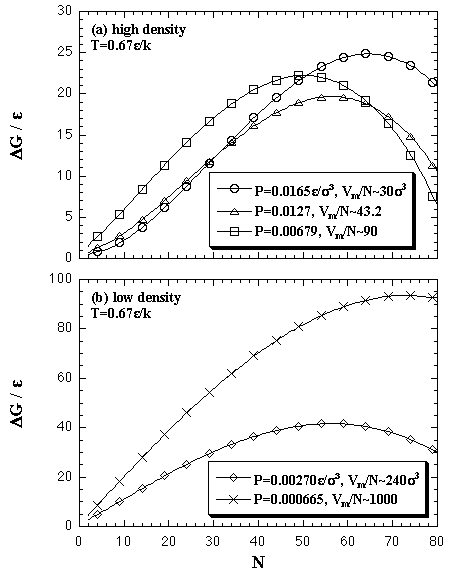 |
| Fig. 5.13. Gibbs free energy of the homogeneous nucleation on (N,T,P) domain. The contribution of the ideal gas term is taken into consideration in the ΔG estimation. The volumes per particle of the monomer phase are mostly close to the figured values at which maxima. |
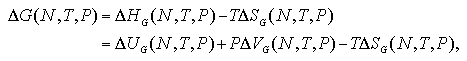
In the case of high-pressure and small-Vm/N system, the volume per particle of the cluster phase becomes fairly smaller: Vc/N ~ 4.3 σ3 at P = 0.0165 ε/σ3, N = 80, and T = 0.67 ε/k. We assumed that the thermodynamic properties of the cluster phase, Uce, Sce, and Uce Vc, do not depend on the density such as eqs. 5.10 and 5.11, that is based on the MC results of Vc/N = 30 up to 1000 σ3 as in Figs. 5.5. and 5.6. However, it is not guaranteed that the thermodynamic properties of the cluster phase are constant against the density in the high-density region as Vc/N < 30 σ3, and the EOS extrapolates the Vc/N in the high-density region. Possibly, in the high-density region, the density dependence that we neglected becomes remarkable; therefore the EOS would contain overestimate the ΔG. On contrary, in low-pressure/low-density region, the EOS of ΔG is in consistent with the one of ΔA because the extrapolation is not remarkable. Figure 5.15 shows the behavior of the components of the nucleation energy:
 | (5.20) |
 | (5.21) |
The effect of the extrapolation in high-pressure/high-density region as the figure (a) is much larger than the one in low-pressure/low-density as (b); the deviation of the TΔSG term raises the ΔG as in figure (a).
 |
| Fig. 5.15. Components of ΔG and ΔA versus N plots. In the high-pressure system (a), the difference TΔSG - TΔSA becomes remarkable with the increase of N, it cancels the negative contribution of the PΔVG and raises the ΔG. On the other hand, the low-pressure (b), the difference between the entropy terms becomes smaller, therefore the difference ΔG - ΔA is almost occupied by the PΔVG contribution and the ΔG becomes lower than the ΔA. |
Here, we consider the reason what the ΔG curve obtains a maximum against the number of particles. The ΔG can be divided into the enthalpy term and the entropy term as in eq. 5.20, while into the ideal gas term and the interaction term as
 | (5.29) |
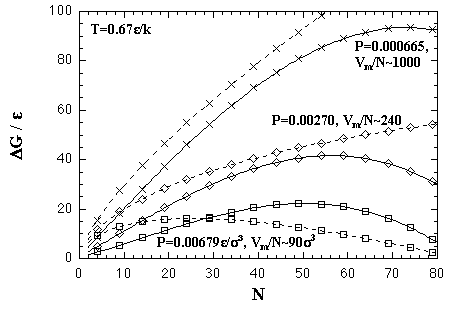
Such components are plotted in Fig. 5.16. In the figure, the ideal gas term is plotted as -ΔGid, then eq. 5.29 can be interpreted as ΔG = ΔGe - (-ΔGid). In the small-N region, the enthalpy term or the interaction term (solid curves) is higher than the entropy term or the ideal gas term (broken curves), and inclination of the former is less than that of the latter. Therefore, the ΔG has a positive value and increases against the number of particles for a while. However, after all, the enthalpy term or the interaction term overtakes the entropy term or the ideal gas term due to increase of the inclination of the formers. Accordingly, the ΔG has a maximum as in Fig. 5.13. The values of the critical nucleus given by the maximum, the size of NG* and the free energy of ΔG*, are plotted in Fig. 5.17 as a function of temperature.
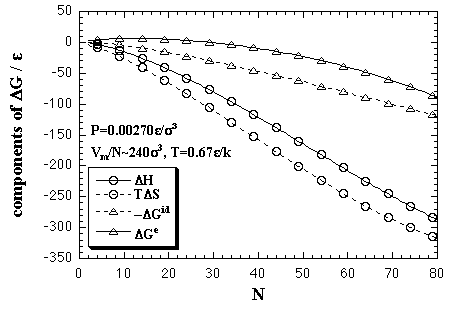 |
| Fig. 5.16. The components of ΔG; the entropy term ΔH and the entropy term TΔS, while the ideal gas term ΔGid and the interaction term ΔGe at P = 0.00270 ε/σ3 and T = 0.67 ε/k. Care should be taken that the ideal gas term is plotted as -ΔGid. |
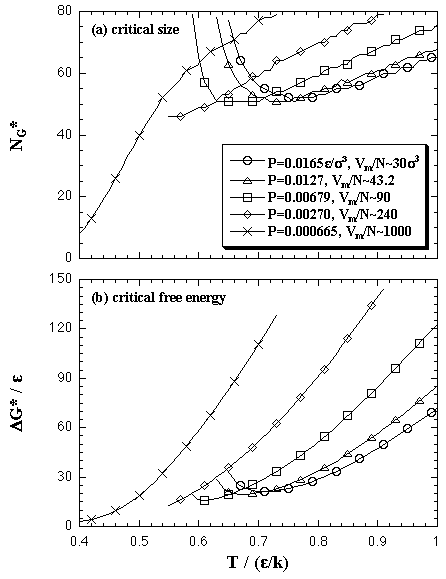 |
| Fig. 5.17. The values of the critical nucleus in (N,T,P) domain: (a) the size NG* and (b) the Gibbs free energy ΔG*. As we stated in the text, the both NG* and ΔG* are overestimated at the high-pressure system. |
|
5.3. Comparison with the Classical Nucleation Theory
and Other Simulations
|
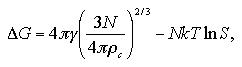
According to the classical nucleation theory as stated in section 1.2.2, the free energy of nucleation is expressed as a function of the number of particles:
 | (1.14) |
Here, the supersaturation ratio S = (P/Pe) is also regarded as (ρ/ρe); ρ and ρe are densities of the supersaturated vapor and equilibrated vapor phases, besides γ = 1.03 ε/σ2, ρc = 0.82 σ-3, and ρe = 0.00161 σ-3 at T = 0.67 ε/k. We compared the EOS and the classical theory in Fig. 5.18. The classical theory underestimates the size of the critical nucleus NG*, and overestimates the critical free energy ΔG*, these have been reported in computational and experimental results.[17,18] Though the EOS also overestimates in both NG* and ΔG*, the values seem to be consistent with the inclination of the classical theory.
 |
| Fig. 5.18. Comparison between the EOS and the classical nucleation theory at T = 0.67 ε/k. The former is plotted as solid curves, and the latter broken curves. |
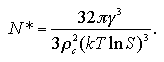
The size and the free energy of the critical nucleus are obtained as eqs. 1.15 and 1.13:
 | (1.15) |
 | (1.13) |
Figure 5.19 shows the comparison between the results of the EOS and the other simulations. Oh and Zeng estimated the NG* and ΔG* of the LJ system by MC simulations of the nucleation in a large system in which they set an upper limit of the size of cluster.[5] Yasuoka and Matsumoto performed MD simulations for the nucleation of LJ system, and also obtained the NG* and ΔG*.[3] As we stated in previous section, since the EOS overestimates the ΔG in high-density region by the effect of the extrapolation of the Vc/N, the reliability of the EOS is scanty in the high-density region. However, it can be expected that the EOS will give a suitable prediction qualitatively except for the region that the NG* and the ΔG* rise against density increase, ca. Vm/N < 100 σ3.
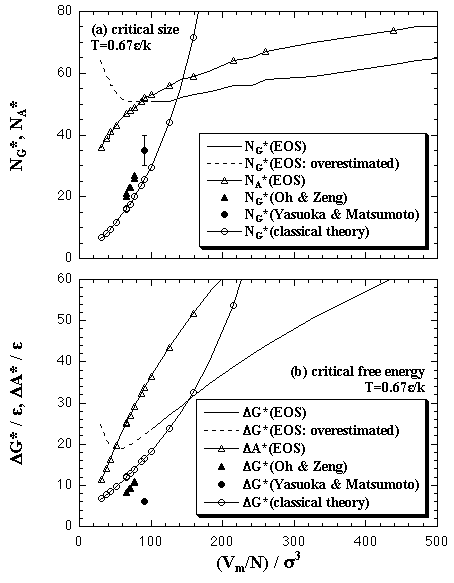 |
| Fig. 5.19. Comparison between the EOS and other simulations in the values of the critical nucleus at T = 0.67 ε/k. The prediction of the classical theory is also plotted. In high-density region, ca. Vm/N < 100 σ3, the EOS of the Gibbs free energy somewhat overestimates in which critical values; that region is plotted as the broken curves. |
In the classical theory, the ΔG gives a maximum against the cluster size due to competition between the surface and the bulk contributions. The classical theory is a prediction from the macroscopic phenomenology. On the other hand, in the EOS from the microscopic MC simulations, the maximum is obtained due to competition between the enthalpy and the entropy terms or the interaction and the ideal gas terms, as stated above. The model daringly simplified the N-particle nucleation as monomer-cluster transition in an N-particle system. Still the model gave the maximum values of ΔG (and ΔA) near to the prediction of the classical theory, and was consistent qualitatively with the classical theory. The agreement suggests that, though many examinations are required, the model is available to predict the nucleation energy.
|